Tutorial 3
Characterization of Stellar Activity Components
This tutorial demonstrates how ARVE can be used to characterize stellar activity components (such as oscillations and granulation phenomena) by fitting the components with analytical functions in the velocity power spectral density (VPSD).
We begin by importing the ARVE package and other useful packages.
[1]:
# Import packages
import arve
import matplotlib.pyplot as plt
import pandas            as pd
For our analysis, we make use of some synthetic RVs computed in Tutorial 0 and downloadable here.
[2]:
# Read RVs
df = pd.read_csv("example_data/tutorial_3/vrad.csv")
time_val = df["time_val"].values
vrad_val = df["vrad_val"].values
vrad_err = df["vrad_err"].values
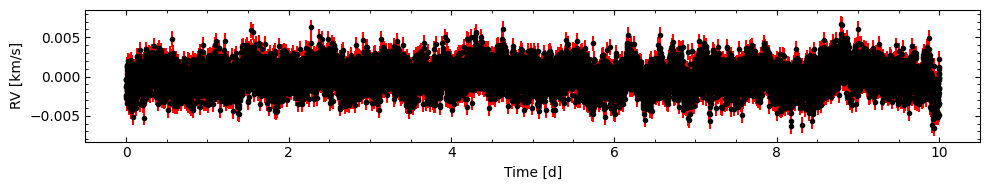
The RVs are fed to an ARVE object and plotted for visualization.
[3]:
# Initiate ARVE object and plot RVs
example = arve.ARVE()
example.star.target = "Sun"
example.star.get_stellar_parameters()
example.data.add_data(time_val=time_val,
                     vrad_val=vrad_val,
                     vrad_err=vrad_err)
fig = example.data.plot_vrad(figsize=(10,2))
plt.show(fig)
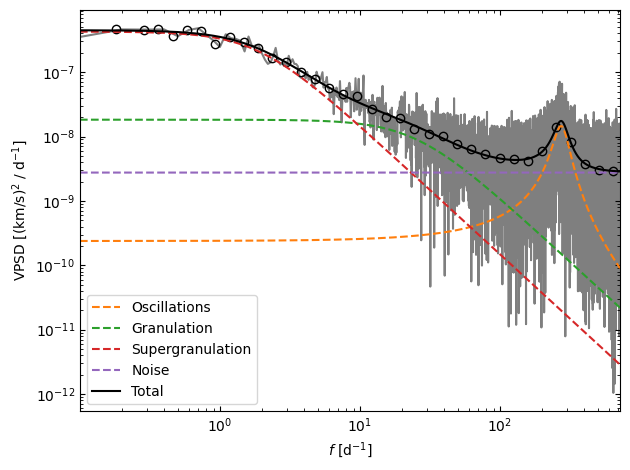
We perform the VPSD analysis in 3 steps:
Compute the VPSD from the input data.
Add the expected VPSD components based on the span and cadence of the input.
Fit the coefficients of the analytical VPSD components to the computed VPSD.
The final results can thereafter be plotted.
[4]:
# Compute VPSD, add VPSD components, fit VPSD coefficients and plot everything
example.star.compute_vpsd()
example.star.add_vpsd_components()
example.star.fit_vpsd_coefficients()
fig = example.star.plot_vpsd_components()
plt.show(fig)
For further analysis, the best-fit VPSD coefficients can be accessed in the ARVE object. For example, the granulation timescale is obtained like this:
[5]:
# Print granulation timescale
print("Granulation coefficient names:")
print(example.star.vpsd_components["granulation"]["coef_name"])
print("Granulation timescale [hr]:")
print(example.star.vpsd_components["granulation"]["coef_val"][1]*24)
Granulation coefficient names:
['amplitude', 'timescale', 'decay rate']
Granulation timescale [hr]:
0.962004134983532